In this project, I implemented Azure Sentinel, a Security Information and Event Management (SIEM) tool, to monitor a “honeypot” I created—a deliberately vulnerable system designed to attract and analyze malicious activity.
The honeypot was configured on a virtual machine (VM) hosted on Microsoft Azure and exposed to the internet.
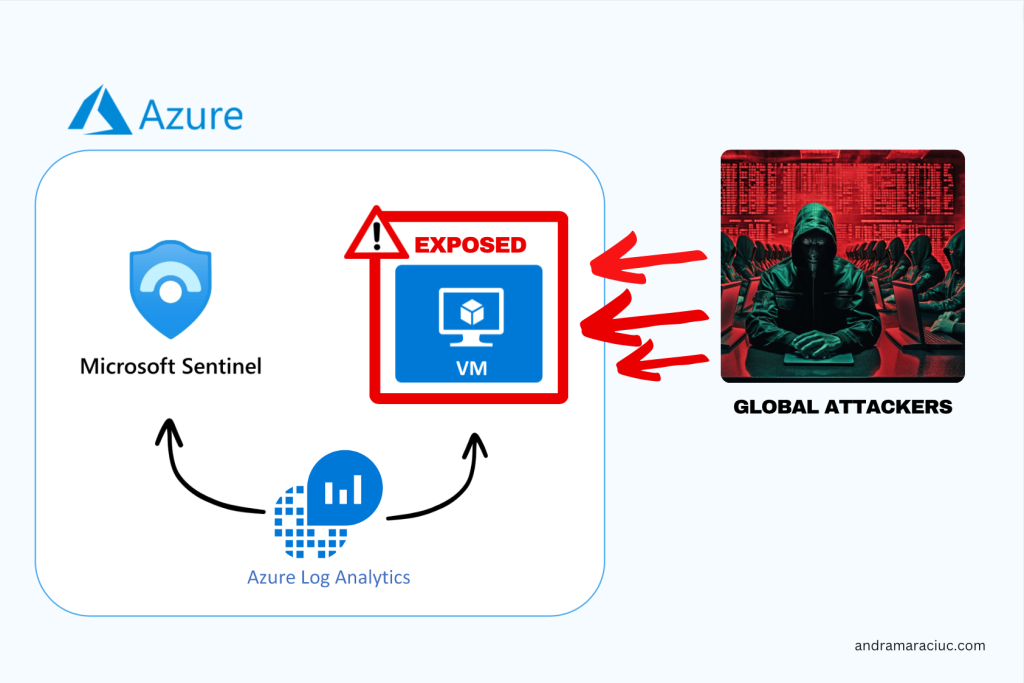
This documentation outlines the key steps to set up Azure Sentinel for monitoring the honeypot, extracting geolocation data from live attacks, and visualizing the results.
Key Steps
1. Azure Subscription
Initiated the project by creating an Azure subscription, providing the foundational access to Microsoft’s cloud services. I got 200E free credit to use for this project.
2. Virtual Machine Setup
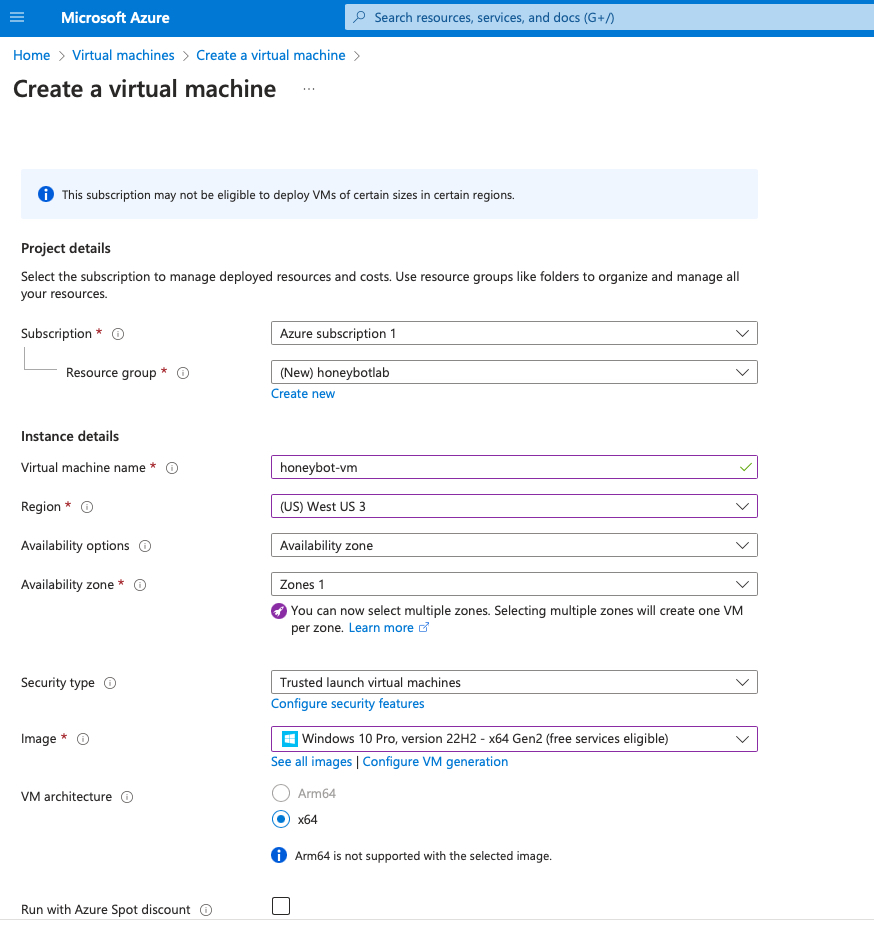
I created a resource group named “honeypotlab” and configured the honeypot on a virtual machine named “honeypot–vm.”
3. NSG and Firewall Settings
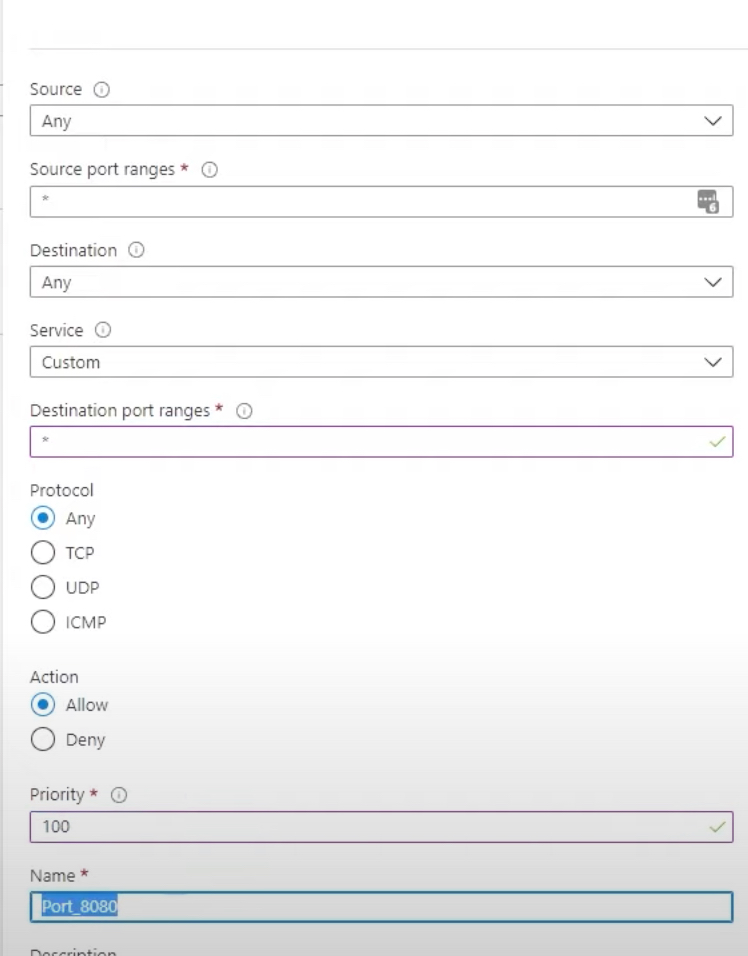
Under Network Security Group, I deleted the default firewall rules and created my own inbound rules which would allow all traffic. This involved intentionally making the VM vulnerable by turning off firewalls and allowing all traffic.
These settings create an environment that mimics real-world scenarios, attracting a diverse range of attacks.
4. Log Analytics Workspace
Created a Log Analytics Workspace to ingest logs from the honeypot VM, including Windows event logs and custom logs containing geographic information about potential attackers.
5. Security Center Integration
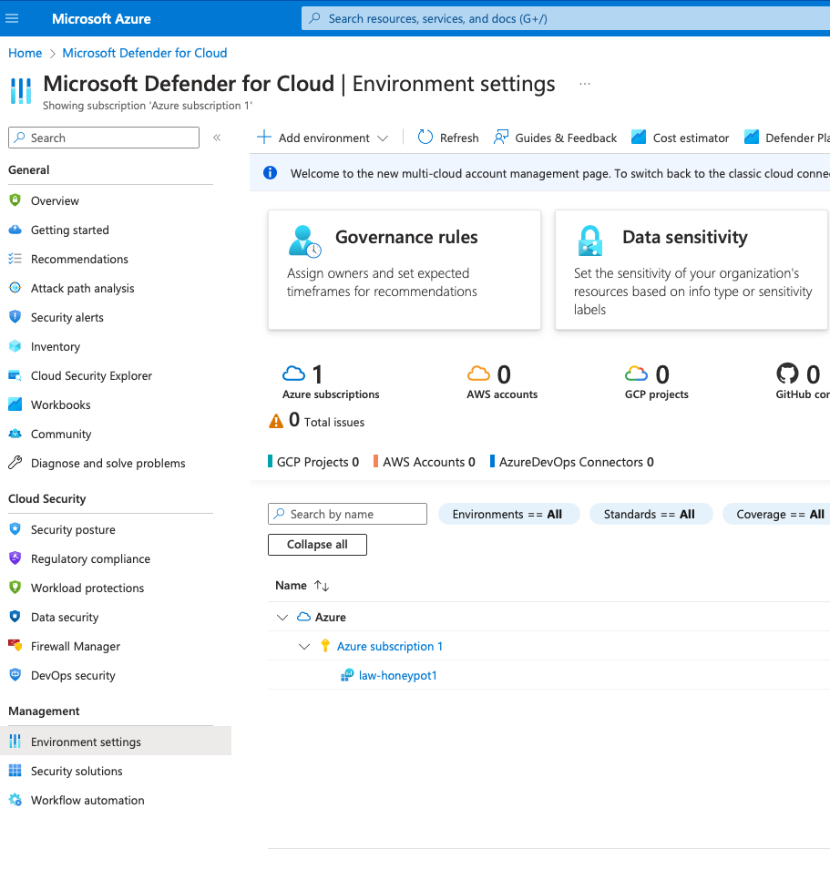
Enabled the Security Center on the VM to gather relevant logs, and activated Microsoft Defender for comprehensive data collection on all events occurring with the virtual machine.
6. Azure Sentinel Setup
Configured Azure Sentinel, a cloud-native SIEM solution, to aggregate and analyze security data, providing crucial insights into potential threats. Azure Defender was enabled and data collection of all events happening with our virtual machine.
7. Remote Desktop Login

Logged into the honeypot VM using Microsoft Remote Desktop for macOS, establishing access to the VM. I used the credentials I chose when I created the virtual machine in Azure.
8. Event Viewer Logs Observation
Explored Event Viewer Logs on the VM, revealing information about failed logins and associated IP addresses. However, these logs are limited as they don’t provide any geographical information.
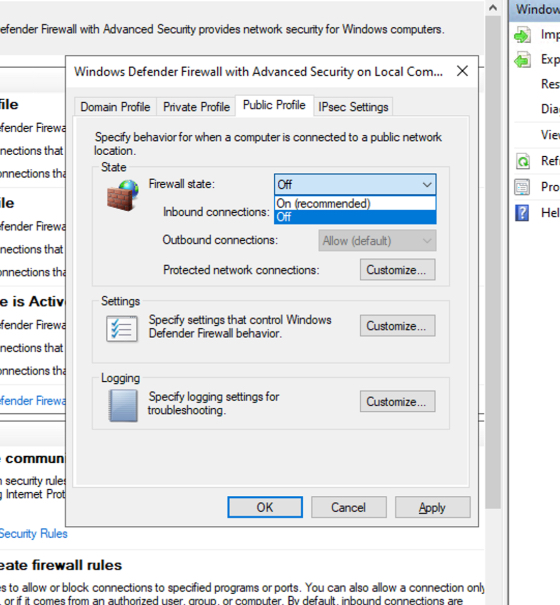
9. Firewall Deactivation
Increased the honeypot’s discoverability by temporarily disabling the firewall.
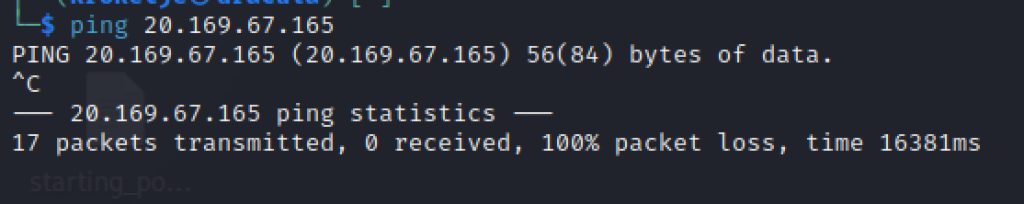
First, I pinged the IP address from my Linux machine, and the connection timed out.
Then I accessed the Windows Defender Firewall Settings from the Remote Desktop, and disabled the Firewall for Domain, Private and Public profile:
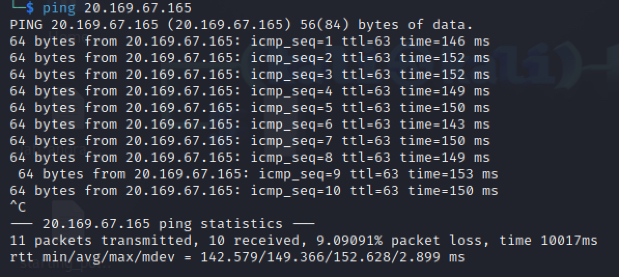
After I turned off the Firewall, all the pings were successful.
10. PowerShell Script and API Integration
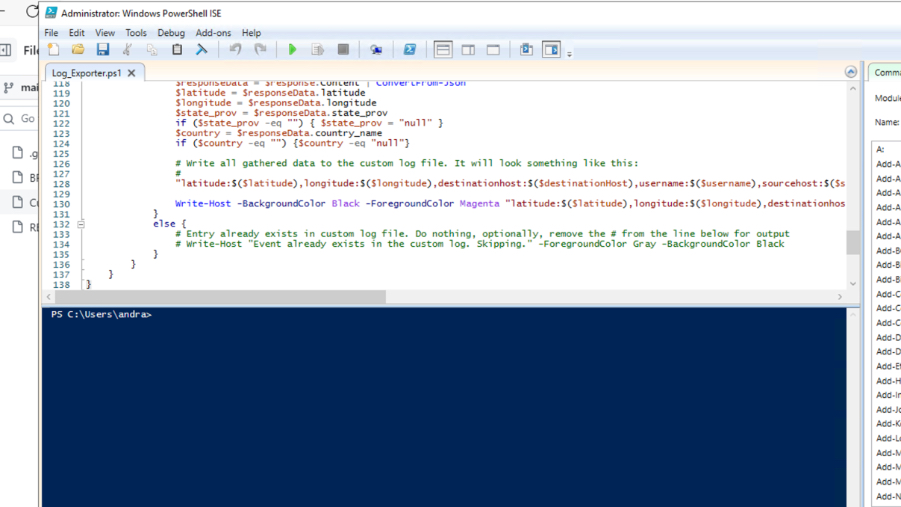
Downloaded a PowerShell script by Josh Madakor, integrated with the Geolocation.io’s API (I got 100 free hits), to convert IP addresses into geographical coordinates, helpful data that we will use to plot the map in Sentinel and visualize the attacks.
11. GEO Script Execution
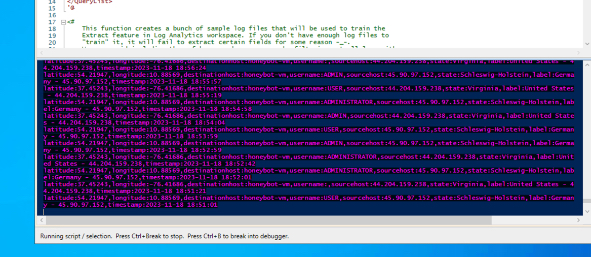
Ran the PowerShell script, and already saw a multitude of attempted attacks from all over the world. These logs were stored in a hidden folder in C:/ProgramData.
12. Custom Log Creation in Azure
To store the collected geolocation data in Azure in a structured manner, I created a custom log within the Log Analytics Workspace where I had to upload a sample of the logs and give the exact path where to find the log file.
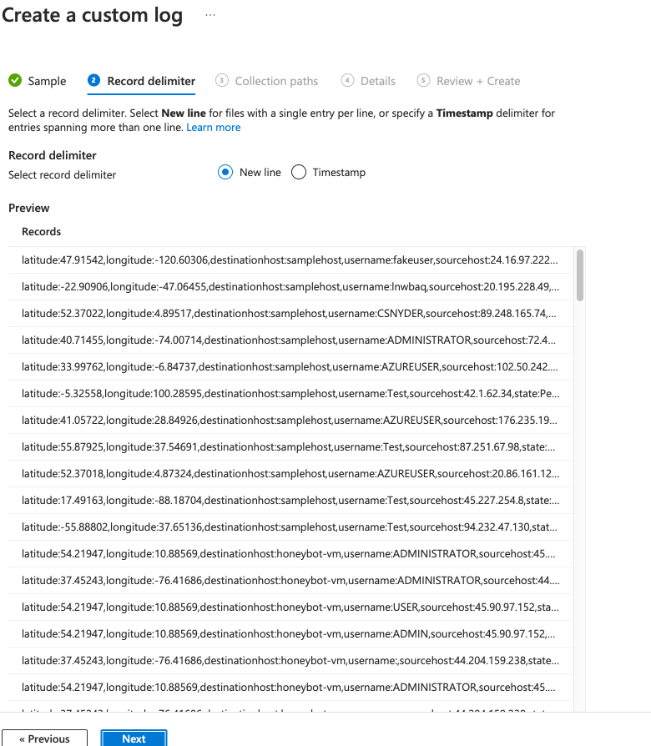
After 15 minutes, all the records started to appear one by one. You can see how many failed login attemps happened with attackers trying to break into the honeypot by trying various username/password combinations (ADMIN, ADMINISTRATOR, USER etc.)
13. Data Extraction and Mapping in Sentinel
In Sentinel, I defined custom fields directly when plotting the map (for better readability), extracted relevant information from raw log data, removed the sample data from Geolocation.io, and configured Azure Sentinel to visualize geolocation data on an interactive map.
14. Map Visualization Optimization
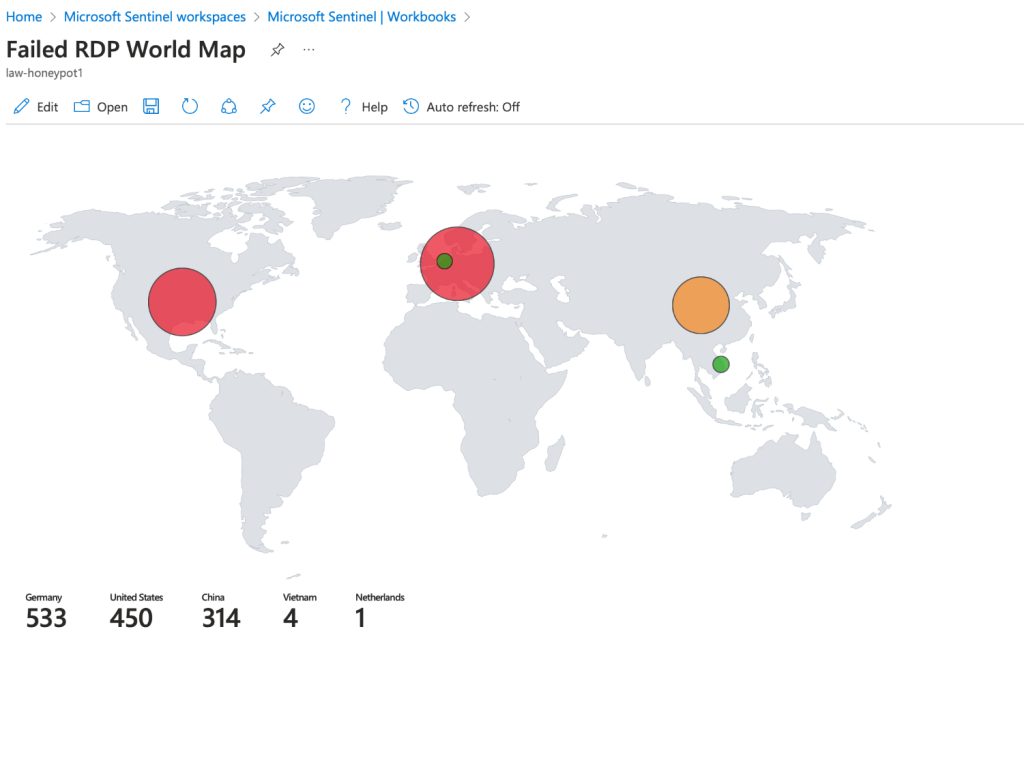
So many attacks from Germany, US, and China, all in less than 2 hours.
Fine-tuned map plot sizes within Azure Sentinel for clear and concise visualization, enhancing the monitoring of live attacks.